


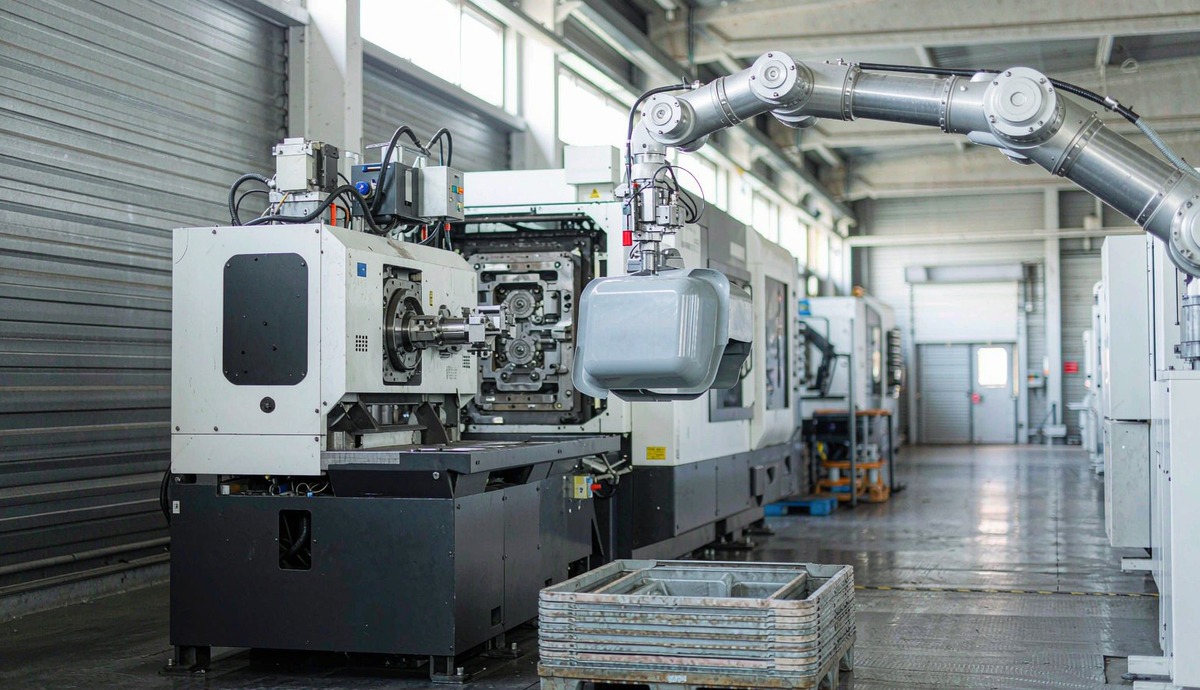
Scaling Product Launches Safely with Low Volume Injection Molding Services
Quick answer: Scaling a product launch safely with low volume injection molding services means releasing money and orders in stages, and refusing to advance to the next stage until the previous stage has produced written, measurable evidence. A safe ramp usually runs as four gates:
- Gate 0 – Tool release: no steel is cut until the DFM review, mold-flow analysis and tolerance stack-up are signed off.
- Gate 1 – First article (T1): every cavity is measured against the drawing before anything ships.
- Gate 2 – Pilot lot: a run-at-rate batch proves the process, not just the part, with capability data on critical dimensions.
- Gate 3 – Bridge to serial: tool wear, cycle-time and scrap trends decide when to cut a production tool, and what class of steel it needs.
Three calculations protect the budget better than any promise from a supplier: how many shots the launch will actually consume, how large the first order should be against forecast error, and when a hardened production tool becomes cheaper than repeatedly renting capacity from a bridge tool. This guide walks through each gate, each calculation, and the failure modes that only appear once volumes rise.
What does “scaling safely” actually mean for an injection-molded product?
Scaling safely means that every increase in order size is justified by evidence collected at the previous order size, rather than by optimism about demand. In molding terms, the part geometry, the process window and the tool condition each accumulate a different kind of proof: the geometry is proven by measurement, the process is proven by repeated runs under normal production conditions, and the tool is proven by shot counts and wear records. A launch that jumps from a handful of prototypes straight to a fifty-thousand-part order has proven none of the three, which is why that jump, not the molding itself, is where most launch budgets fail.
The logic matters because injection molding front-loads its costs in a way few other processes do. A mold is a capital asset that is expensive to modify: a design change discovered after tooling release can consume weeks of machine time and a four-to-five-figure rework bill, while the same change discovered at the DFM stage costs a CAD revision. Low volume molding exists precisely to move those discoveries earlier, when they are cheap. Treating it as “small production” instead of “risk retirement” wastes its main benefit — which is why the stage-gate approach below insists that each batch must answer a specific question before the next batch is ordered.
Buyers sometimes assume that safety comes from choosing a bigger, better supplier. Supplier capability matters, but a capable supplier cannot rescue a program that changes its own design mid-ramp or orders volume it cannot sell. The controls that keep a launch safe are mostly buyer-side disciplines: frozen revisions, written gate criteria, and order quantities sized from data. The sections below turn each of those disciplines into concrete, checkable requirements you can put straight into a purchase order. For the supplier-side equivalent, see the companion guides on sourcing custom plastic injection molding and on auditing a molding manufacturer for precision work.
Which stages should a low volume molding launch pass through?
A launch should pass through four gates, each with its own purpose, evidence and exit question. The table below is the map; the sections after it define the evidence in detail.
| Gate | Question it answers | Typical output | Exit criterion |
|---|---|---|---|
| 0 – Tool release | Is the design ready to be cut into steel or aluminium? | Signed DFM report, mold-flow analysis, tolerance stack-up | Buyer and molder both sign; open issues listed with dispositions |
| 1 – First article (T1) | Does the tool produce the drawing, cavity by cavity? | Full dimensional layout on every cavity, material certs | 100% of critical and major dimensions in tolerance |
| 2 – Pilot lot | Does the process hold up under production conditions? | Run-at-rate batch, capability study, assembly trial | Ppk ≥ 1.67 on critical dimensions; assembly and packaging verified |
| 3 – Bridge to serial | When and how should production tooling replace the launch tool? | Wear, cycle-time and scrap trends; ECN log closed | Trend data supports the tool-class decision |
The gates are sequential for a reason: each one spends money to retire a specific class of risk, and skipping a gate means that risk reappears later at a higher price. Gate 0 retires design risk, Gate 1 retires tooling risk, Gate 2 retires process risk, and Gate 3 retires supply risk. A team that runs all four in order typically spends more calendar weeks than one that does not — but it spends its tooling budget once, not twice, and that difference is usually the larger number.
Not every product needs all four gates at full depth. A replacement part with an existing validated design can compress Gates 0 and 1 into a document check, while a novel medical or automotive part may add regulatory documentation to every gate. What should never be compressed is the principle: advance only on evidence. The gate structure scales up and down; the discipline does not.
What evidence should each gate produce before you release more capital?
Gate 0, tool release, should close with four documents, because these four are what make later disputes traceable. The DFM report lists every geometry concern — wall thickness variation, draft angles, sink risk near ribs, undercuts — with the molder’s proposed resolution for each. The mold-flow analysis shows fill pattern, weld-line locations, pressure drops and cooling behaviour, and explains what the runner and gate design does about them. The tolerance stack-up proves that the drawing’s tolerances are mutually achievable given the planned mold construction. Finally, a signed tooling specification names the mold class, steel, cavitation, gate type and expected shot life, so that the price and the tool are the same object. If any of these is missing, Gate 0 is not closed; it is merely rushed.
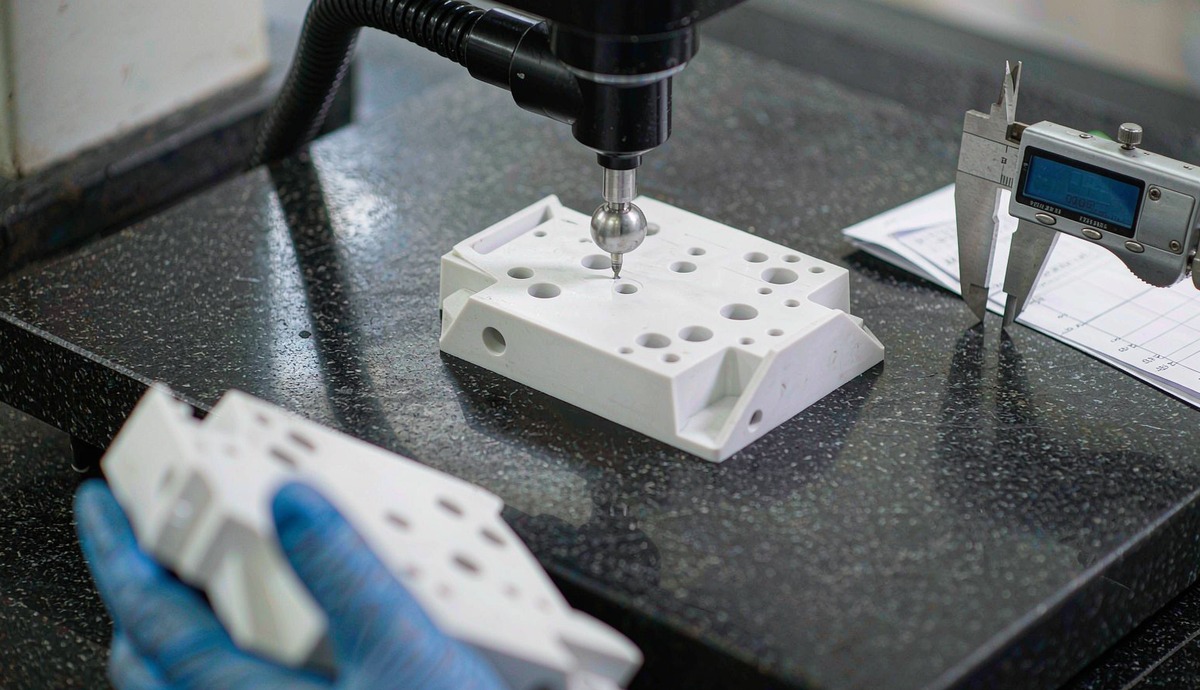
Gate 1, first article, is where cavity-level reality replaces expectation, and the evidence standard is simple: measure everything once, on every cavity. A proper first-article layout measures all dimensions on the drawing for parts from each cavity, not just the three the supplier finds convenient, because cavities are individually cut and individually imperfect. The report should identify each part by cavity number — which requires that the mold carry cavity identification marks — and should record the actual measurement, the tolerance, and pass or fail for each line. Cosmetic boundary samples, agreed physically and photographed, settle future appearance arguments before they start. A first article that only samples one cavity has validated one cavity; the others remain unproven until Gate 2 catches up.
Gate 2, the pilot lot, converts part-level evidence into process-level evidence, and this is the step most often skipped by teams in a hurry. The pilot should be a run-at-rate batch: molded on the production press, with production resin, production regrind ratio and normal cycle time, at a quantity large enough to see normal variation — commonly several hundred to a few thousand parts. From that batch, take a capability study on the critical dimensions: automotive practice, for example, expects roughly 300 consecutive parts and a short-term capability index of Ppk ≥ 1.67 on critical characteristics. The pilot also feeds the downstream reality checks that a lab cannot simulate: assembly on the actual line, packaging and transit testing, and functional or regulatory samples from real molded material. Parts from each cavity should remain traceable through the batch, so that if one cavity drifts, the affected serial range is known.
Gate 3 is different: it produces no single document, but a trend, and the trend is what makes the tooling decision rational. From the pilot onward, the molder should log shot counts, cycle time, scrap rate and any dimensional drift against the mold maintenance record. Those curves answer the only question that matters at this gate: is the launch tool degrading gracefully, and how much more life does it honestly hold? The answer feeds directly into the tool-life arithmetic in the next section, which decides whether the program needs a production tool at all, and if so, of which class.
How many shots will your launch consume — and which mold class survives it?
Shot arithmetic is the calculation suppliers rarely do for you, and it decides the tooling budget more than any quote negotiation. A shot produces as many parts as the mold has cavities, so total shots = (total parts needed, including scrap and validation) ÷ cavitation. Launch demand is bigger than it first appears, because it must cover the pilot lot, the first replenishment orders, scrap and start-up allowances, and the parts consumed by first articles, capability studies and samples — commonly 8–10% on top of the visible quantities. Only after that number is honest does the mold class conversation become meaningful.
Mold classes exist precisely to price expected shot life, and quoting them in the tooling specification prevents the two classic sourcing mistakes: overbuying cycle life the program will never consume, or underbuying and wearing a tool out mid-ramp. Industry shorthand runs as follows.
| Mold class | Typical steel | Expected shot life | Best-fit launch role |
|---|---|---|---|
| Class 105 – prototype | Aluminium or soft alloy | About 500 – 5,000 shots | Fit and form checks, show samples, first customer builds |
| Class 104 – low volume / bridge | Aluminium (7075) or mild steel | Up to ~100,000 shots on easy resins; 5,000 – 30,000 is the honest planning band | Pilot lots, first sellable batches, bridge production |
| Class 103 – mid volume | P20 pre-hardened steel | Roughly 100,000 – 500,000 shots | Low-to-mid serial production, one-tool launches |
| Class 102 – high volume | H13 hardened steel | Roughly 500,000 – 1,000,000 shots | Established products with multi-year demand |
| Class 101 – maximum life | Fully hardened H13/S7, premium build | 1,000,000+ shots | Multi-year, high-cavitation programs |
Two corrections keep this table honest. First, resin is a multiplier, not a footnote: glass- and mineral-filled compounds act like liquid sandpaper and can cut soft-steel mold life by 30–70% at identical shot counts, and corrosive resins such as PVC pit unprotected steel. A Class 104 aluminium tool that runs unfilled polypropylene for 50,000 shots may flash at 8,000 shots on a 30% glass-filled nylon. Second, maintenance, not steel, decides where in the range a tool actually lands: vents foul, cooling channels scale, and moving parts wear on a schedule of roughly 25,000–50,000 shots between teardowns. A tool without a maintenance log is a tool without a predictable life, whatever its class.
A worked example shows how the numbers bind together. Suppose a consumer product plans a 2,500-part pilot and a first production batch of 5,000, with 8% scrap allowance and about 200 parts consumed by validation — roughly 8,300 parts in the launch window. A two-cavity bridge tool consumes about 4,150 shots for that window, well inside even a conservative aluminium tool’s life. If the year-one forecast is 12,000 units, the same tool needs about 6,500 shots in total, still viable but with thinning headroom for a second design iteration. That headroom — tool life minus shots consumed minus shots one more revision would cost — is the real definition of “scaling safely”, and it is a number, not a feeling. The choice between an aluminium bridge tool and a P20 production tool then becomes arithmetic instead of habit; the trade-offs are set out in the comparison below.
Which failure modes only appear once volumes rise?
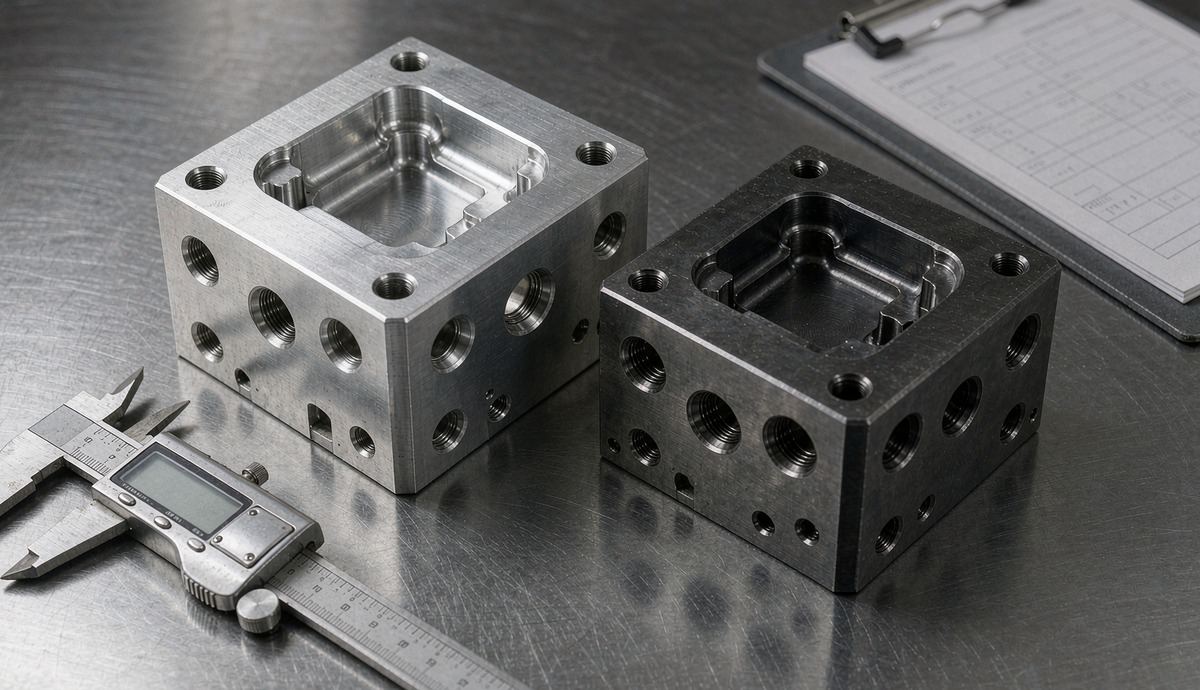
Launch batches hide failure modes that only surface as shot counts accumulate, which is why a part that was perfect at 500 pieces can flash, drift or cycle slower at 15,000. The table below lists the six that account for most ramp-stage surprises, what you will observe, and the control that catches each.
| Failure mode | What you observe | Control that catches it |
|---|---|---|
| Gate and parting-line wear | Flash appears and grows; dimensions at the parting line drift | Shot-count-based maintenance triggers; flash inspection every run |
| Cooling-channel fouling | Cycle time creeps up 5–10%; warpage reappears on old defects | Log cycle time per batch; flow-test channels at maintenance intervals |
| Resin lot change | Shrinkage shifts; tight features move toward a tolerance limit | Certificates of analysis per lot; first-off measurement per lot change |
| Press or cavitation change | Same tool, different parts — shear and cooling history differ | Fix press and cavitation in the process sheet; re-validate on change |
| Regrind ratio variation | Melt viscosity and colour wander; brittle parts occasionally | Cap regrind percentage in the process sheet and police it |
| Ejector and slide wear | Witness marks deepen; slider-formed features go out of position | Wear-part replacement on tolerance at teardown, not on failure |
What unites these six is that none of them shows up in a first article, because all of them are functions of accumulated shots, resin lots or thermal history rather than of tool construction. That is exactly why the Gate 3 trend log matters: cycle-time creep and flash growth are early-warning instruments, and reading them on a schedule converts an emergency retooling into a planned one. A molder who can show you these curves — like the process monitoring described on the quality control system page — is a molder whose tool-life promises have data behind them. The broader catalogue of molding defects and their causes is covered in the guide to injection molding defects and prevention.
How do you keep design changes from multiplying tooling cost during the ramp?
Change control is the cheapest insurance in a launch, because uncontrolled revisions are the classic way one tool becomes three. The mechanism is simple to state: every design change is a numbered engineering change note (ECN) that names the affected drawing revision, the reason, the parts already molded under the old revision, and the tool work required. Every cavity carries an engraved revision or cavity ID, so any finished part can be traced to the revision that produced it. And the rule that does most of the work: parts molded before an ECN are quarantined until someone decides their disposition in writing, because “probably fine” inventory has a way of being assembled into finished goods the week before an audit.
The deeper discipline is deciding what freezes when. Geometry that touches the tool — wall thickness, undercuts, gate location, ejection surfaces — should be frozen at Gate 0, because changes there buy you a mold rework, not just a CAD edit. Geometry that does not touch the tool — labels, colours carried by masterbatch, non-molded attachments — can stay flexible through the ramp. Teams that reverse this, freezing cosmetic details early and “improving” wall sections late, spend their tooling budget on the wrong kind of change. When a change to tool-touching geometry genuinely is required, the ECN should state which cavities are affected, because a four-cavity mold can be reworked two cavities at a time, keeping partial output alive during the modification.
Changes also restart the validation clock, and pretending otherwise is how escaped defects happen. A revision that alters fill, shrinkage or a critical dimension invalidates the capability study behind it, which is why mature programs define in advance which change classes require a full re-run of Gate 2 and which need only a first-off comparison. Writing that rule before the first ECN arrives removes the argument from the moment when someone is pressing to ship. The supplier’s side of this discipline — documenting each change and its verification — is part of what the article on sourcing custom injection molding suggests you audit before the award.
Bridge tool or production tool: what does each route actually cost?
The tooling route is a cash-flow decision dressed as a technical one, and laying the routes side by side makes the trade-offs explicit. Three routes cover most launches: run the whole ramp on one mid-class steel tool, use a cheap aluminium bridge tool first and cut steel later, or run a bridge tool in parallel while a production tool is built. The right choice depends on how certain the design is, how fast demand will ramp, and how much tooling budget can be committed before the first revenue arrives.
| Route | Tooling cost | Lead time to first parts | Unit cost at volume | Choose when |
|---|---|---|---|---|
| A – One P20 tool (Class 103) for everything | Medium — roughly 60–70% of a premium tool’s price | 4–6 weeks typical | Lowest, from the first batch | Design is frozen and year-one volume is credible |
| B – Aluminium bridge tool, then steel | Lowest upfront — roughly 25–35% of a premium tool’s price | 1–3 weeks typical | Higher during bridge phase; you pay twice in total | Design may still change, or demand proof is needed before committing |
| C – Bridge tool in parallel with a production tool | Both tools at once, staggered | Fast, and continuous through the changeover | High early, low after changeover | Demand is confident and stock-outs would cost more than tooling |
Route B is the default for genuinely uncertain launches, and its hidden cost is worth naming: the bridge tool’s shots are consumed on a tool you will retire, so every unit it molds carries a share of a sunk cost. Route C converts that sunk cost into insurance — it suits products whose demand forecast is confident enough that a supply gap during a tool changeover would cost more than the second tool. Route A is the most capital-efficient when it works, and it works exactly when the Gate 0 freeze has held; if it has, buying Class 103 life “just in case” Class 102 is needed is usually over-buying, because the crossover point where a hardened tool beats a P20 one on total cost sits around half a million total shots — far beyond most first-year launch volumes. The mechanics behind these tool routes are described further in the guides to soft tooling versus hard tooling and to mold manufacturing.
Whatever the route, write the tooling specification as a purchase-order line item with the same care as the part drawing: mold class, steel and hardness, cavitation, gate type, expected shot life, maintenance interval and the data (shot log, maintenance log) the molder must return with the tool. A tool without a written life expectation cannot fail against one, and a buyer without one has agreed, by default, to absorb every surprise. The gate design and runner choices embedded in that specification are not minor details; they set both the part cost and the tool’s wear pattern, as the guide to gating system design explains.
How large should the first production order be?
First-order sizing is a two-sided risk calculation, and both sides have numbers. Order too little and you pay for a second run: set-up, minimum-lot premiums, expedited freight and — the expensive one — the weeks of stock-out while it runs. Order too much and you hold cash in inventory that a design revision, a packaging change or slow sell-through can strand. The discipline is to size the order from replenishment math, not from the launch plan’s best case.
The working formula is the standard one: order quantity = expected demand during the molding lead time, plus safety stock, where safety stock scales with forecast error — commonly a z-factor (about 1.65 for a 95% service level) multiplied by the standard deviation of demand over the lead time. If weekly demand is 250 units, the molder’s lead time is six weeks, and forecast error is about 30%, the order is roughly 1,500 units plus a safety stock near 650 — call it 2,200 units, not 10,000. The formula’s real lesson is that lead time and forecast error, not unit price, drive first-order risk: halving forecast error does more for launch safety than any per-part discount, and every week cut from lead time releases proportionally less capital into inventory. This is also why a nearby, communicative molding partner changes the math: shorter and more reliable lead times shrink the order you must risk, an effect described from the buyer’s side in the guide to getting an accurate molding quote.
Low volume molding changes one more variable in this calculation: minimum economic run size. Because bridge tools and short-run tooling reduce set-up penalties, they make smaller reorder batches viable, so a launch can follow demand instead of forecasting it. A practical pattern is a modest first order sized by the formula, then reorder triggers tied to actual sell-through, with the Gate 3 trend log deciding whether each reorder runs on the bridge tool or waits for steel. Products that succeed this way scale on data; products that fail do so with unsold inventory measured in hundreds, not tens of thousands.

What validation from a pilot lot does not carry into serial production?
More validation evidence expires than teams expect, because validity is tied to conditions, and serial production changes conditions. A capability study is attached to a specific press, a specific mold in a specific condition, a specific resin grade and often a specific lot, and a defined cavitation. Change any of those and the study measures something that no longer exists. The practical rule for a launch program is to list, in the quality plan, exactly which changes invalidate which evidence — so that when one happens, the re-verification is a lookup, not a debate.
The common triggers deserve explicit treatment. Moving the tool to a different press changes the plastic’s shear and thermal history, so dimensional behaviour can shift even with identical settings; re-validate rather than assume. Changing cavitation — adding a cavity to meet ramp demand — changes cooling balance and often shifts shrinkage on every part; the new cavitation needs its own first article, and the tool needs a fresh capability study. Switching resin supplier or grade, even to an “equivalent”, moves melt flow and shrinkage, so first-off measurement per lot change is the minimum. Time itself is a trigger: many quality plans require periodic re-validation (for example, annually, or after a defined shot count) because tool wear slowly moves the process mean even when nothing else changed. Regulated programs — automotive to IATF 16949 expectations, medical to ISO 13485 — formalize exactly these triggers, which is why their launch documentation looks heavier: the weight is the price of provable continuity.
The buyer’s protection is a closing document. At Gate 3, require a validation status sheet that lists every validation performed, its scope (press, mold, resin, cavitation, revision), and whether it remains current for the serial process as it will actually run. Gaps on that sheet are not paperwork defects; they are the specific places where serial production can produce a nonconforming batch that pilot testing never foresaw. This is also the moment to confirm the maintenance program that keeps the tool inside its validated window — work described in the guide to mold repair and maintenance.
Frequently asked questions about scaling launches with low volume molding
How many parts count as a “low volume” injection molding run?
There is no universal threshold, but the practical band is a few hundred to roughly 50,000 parts per batch, with 500–10,000 being the most common launch window. What actually defines the category is not the count but the tooling economics: volumes small enough that a full production tool is not yet justified, and batches short enough that the program benefits from fast tool changes and flexible scheduling. Once annual demand is credibly above roughly 100,000 parts and the design is frozen, a Class 103/104 production tool usually becomes the better economic answer, and the program graduates out of low volume.
Is aluminium tooling good enough for real production, not just prototypes?
Yes — within its shot budget. Modern aluminium alloys such as 7075 mold production-grade parts from production resins, and a well-maintained aluminium bridge tool can realistically deliver thousands to tens of thousands of shots on unfilled resins, enough to cover pilot lots and early sellable batches. The limits are abrasive fillers, which cut tool life dramatically; high-tonnage projects with large projected areas; and very long total programs, where steel’s wear resistance wins. The mistake to avoid is treating aluminium’s best case as its default case: ask for the shot-life expectation in writing, for your resin, and log actual shots against it from the first batch.
When should a launch move from low volume to high volume tooling?
The trigger is arithmetic, and it has three inputs: annual demand, remaining bridge-tool life, and the cost gap between the tools. Move when the forecast says the next twelve months will consume more shots than the bridge tool can honestly deliver, when unit-cost savings at volume will repay the production tool within that horizon, or when the design has stabilized enough that a Class 103/102 tool will not be stranded by a revision. Running the two tools in parallel for one changeover quarter is normal and usually cheaper than a supply gap; the comparison in the tooling-route section above shows how to stage it. The full contrast between the two regimes is covered in the article on low-volume versus high-volume injection molding.
What documents should a molding supplier deliver at each gate?
Gate 0: signed DFM report, mold-flow analysis, tolerance stack-up and tooling specification. Gate 1: full dimensional first-article report for every cavity, material certifications and agreed cosmetic boundary samples. Gate 2: run-at-rate record, capability study on critical dimensions, assembly and packaging trial results. Gate 3: shot log, maintenance log, cycle-time and scrap trends, a closed ECN log and the validation status sheet. Suppliers who produce these without being chased are telling you how the rest of the program will run; suppliers who resist them are telling you that too. For precision programs, the audit guide on auditing a molding manufacturer shows how to verify these systems on site before the award.
Can regulated products (automotive, medical) use low volume molding for launch?
Yes, and many do — the process is identical, but the documentation burden scales with the sector’s requirements. Automotive programs should expect production part approval logic (measurement, capability, appearance approval) applied at the pilot gate, and material and process changes handled through formal change requests. Medical programs add design-history-file and process-validation discipline, so the low volume phases become documented stages of process validation rather than informal builds. In both sectors the stage-gate structure above is an asset rather than an overhead: it generates exactly the evidence the sector’s quality system will later ask for, in the order the evidence is naturally produced.
Scale your next launch with a molding partner that documents every gate
DJmolding is a plastic injection molding manufacturer founded in 2010 and based in Guangdong, China, operating a 15,000 m² facility with in-house mold design, mold-flow analysis and mold making on CNC machining centres, EDM and wire EDM. The company supports the full launch path described in this guide — from rapid prototyping and bridge tooling through low volume manufacturing to high volume production — with first-article reports, capability data and tool maintenance logs supplied as standard at every gate. Program capabilities include custom plastic injection molding, overmolding, insert molding, two-color molding and LSR molding for automotive, electronics, appliance and consumer brands.
If you are planning a launch, send DJmolding your part files, target volumes and launch timeline: the team will return a DFM review, a tooling-class recommendation with shot-life arithmetic, and a stage-gate plan matched to your budget curve. B2B buyers — brands, distributors, OEM engineering teams and contract manufacturers — can request a quotation or schedule a factory audit (on site or by video) through the contact page, and explore the full service range on the molding service and on-demand manufacturing pages. Bring the gates forward: the earlier the evidence, the cheaper every decision after it.
